
The Silk Bridge Report: July 2025 Edition
Sold Market Update
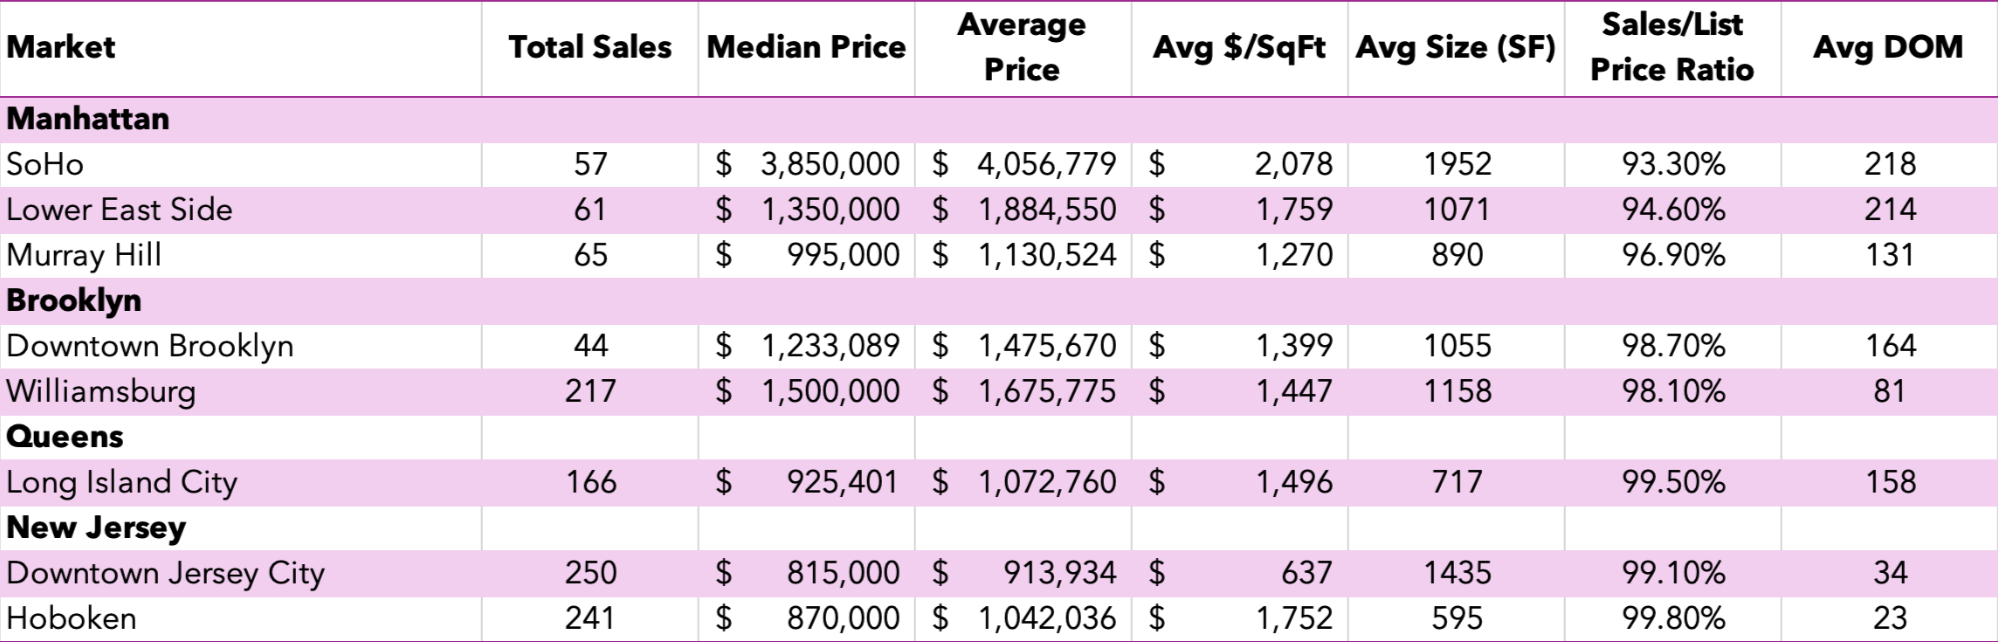
The first half of 2025 shows significant variations across our tracked markets. With 1,101 total closed sales, we see prices ranging from $637/sqft in Downtown Jersey City to $2,078/sqft in SoHo. Days on market vary dramatically from just 23 days in Hoboken to 218 days in SoHo, reflecting different pricing strategies across markets.
Active Market Update
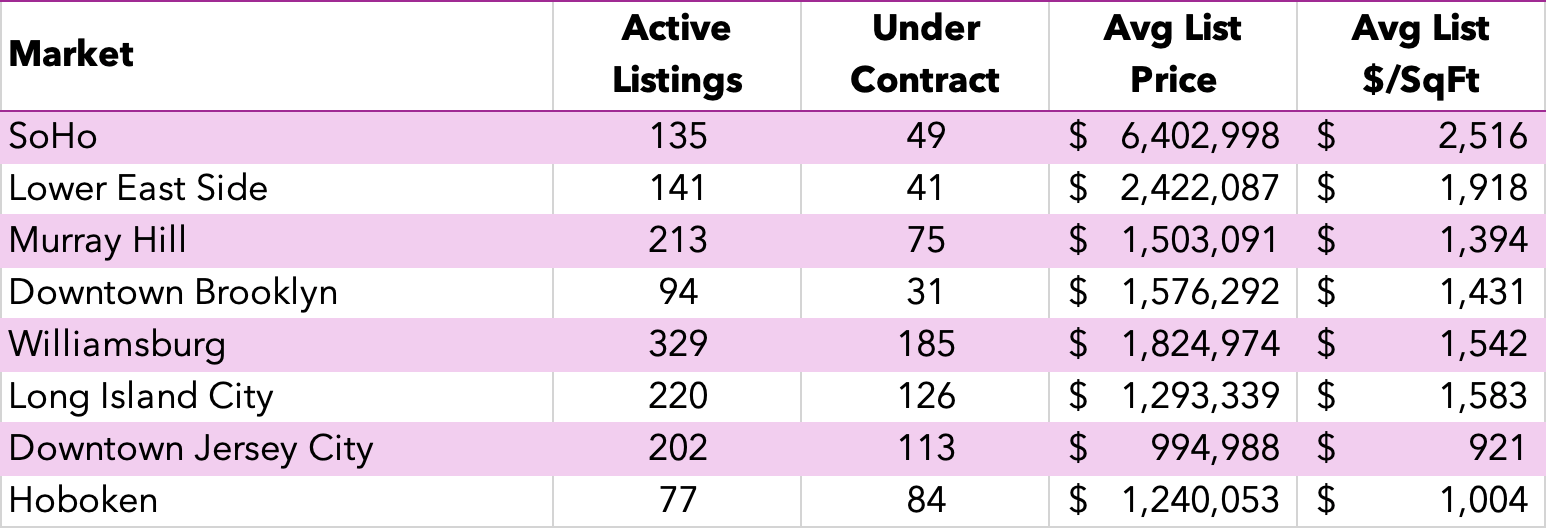
Active inventory varies dramatically across markets, from Hoboken's seller's market with more properties under contract (84) than available (77), to Williamsburg's buyer-friendly environment with 329 active listings, while Manhattan listings command premium asking prices ranging from $1.5M in Murray Hill to $6.4M in SoHo.
MARKET ANALYSIS
So what do all these numbers actually mean for you? Beyond the headlines of median prices and inventory counts, the real insights come from understanding how properties are priced relative to where they ultimately sell – and how quickly that happens.
MARKET OPPORTUNITIES FOR BUYERS
- Best Value: Downtown Jersey City at $637/sqft offers the lowest entry point
- Manhattan Value: Murray Hill at $1,270/sqft provides a Midtown Manhattan address at a Mid-Low $/sqft
- Most Choice: Williamsburg leads with 329 active listings
- Pricing Adjustments: SoHo and Lower East Side properties averaging 200+ days on market signal pricing above initial market expectations
MARKET OPPORTUNITIES FOR SELLERS
- Fastest Sales: Hoboken (23 days) and Downtown Jersey City (34 days) lead velocity
- Strategic Pricing Success: Hoboken (99.8%), Long Island City (99.5%), and Downtown Jersey City (99.1%) show competitive pricing drives results
- High Demand: Hoboken has more buyers than listings (84 under contract vs 77 active)
- Extended Market Time: Manhattan markets averaging 130-218 days suggest initial pricing strategies need adjustment
DECODING SALE-TO-LIST PRICE RATIO
The sale-to-list ratio tells us about pricing strategy, not discounts. Here's what the numbers really mean:
- Above 99%: Properties in Hoboken (99.8%), Long Island City (99.5%), and Downtown Jersey City (99.1%) show sellers pricing strategically at or slightly below market value to generate competitive offers and quick sales.
- Below 97%: Manhattan markets like SoHo (93.3%), Lower East Side (94.6%), and Murray Hill (96.9%) indicate initial pricing above market value, requiring adjustments to meet buyer expectations. The extended days on market (200+ days in SoHo and LES) confirm this pricing disconnect.
OUR TEAM'S RECENT SUCCESS
The Silk Bridge Team has closed approximately $10M in sales year-to-date, demonstrating expertise in securing true discounts for buyers and achieving premium results for sellers. Here are three standout transactions that showcase our market knowledge:
- SoHo: Exceptional Buyer Discount Secured at 210 Lafayette Street #8BC - $3,571,000 | 2,470 sqft
We secured this luxury condo for our buyer at $1,445/sqft - a remarkable 30% discount below the market average of $2,078/sqft. In a market where properties sit for 218 days on average, our deep understanding of SoHo's pricing dynamics allowed us to identify and negotiate exceptional value, saving our client over $1.2 million compared to market rates.
- Kips Bay: Premium Achieved for Seller at 333 East 30th St #4-N - $830,000 | 726 sqft
Adjacent to Murray Hill, the Kips Bay Towers development averaged $1,094/sqft with properties taking 81 days to sell in the broader Kips Bay neighborhood. We achieved $1,143/sqft for our seller - a 4.5% premium above building average - in just 44 days on market. This sale outpaced the neighborhood by 46% and exceeded building averages — a direct result of our tailored pricing strategy, high-impact marketing, and precise market positioning.
- Columbia Street Waterfront District: First-Time Buyer Savings Delivered at 48 President St #34B2 - $703,000 | 665 sqft
Located south of Downtown Brooklyn and Williamsburg, this waterfront neighborhood offered unique value. We secured this 1-bedroom for our first-time buyers at $1,057/sqft - an 18% discount below the neighborhood average of $1,284/sqft. This $227/sqft savings translated to over $150,000 in real value for our clients entering the market.
LOOKING AHEAD
- For Buyers: The data reveals opportunities in markets where initial pricing exceeded market expectations. Manhattan markets, particularly SoHo and Lower East Side, show properties requiring price adjustments after extended market time. Downtown Jersey City continues to provide exceptional value at $637/sqft for those seeking more space. For NJ Buyers in particular, the previously known Mansion Tax shifts to the Seller and be called the Graduated Percent Tax as of July 10th, 2025, which will reduce their cost burden at closing when they buy properties North of $1 million.
- For Sellers: New Jersey markets demonstrate the power of strategic pricing, with Hoboken and Downtown Jersey City properties moving in under 35 days when priced to create competition. Limited inventory in these markets rewards well-positioned properties. It's possible that the new fee discussed above may either cool this slightly by causing Sellers to increase their prices, which could stabilize demand, or heat this up further by causing Sellers to rethink if they want to sell, and constricting inventory.

Listing Courtesy of Brown Harris Stevens Residential Sales LLC


Listing Courtesy of Brown Harris Stevens Residential Sales LLC
MANHATTAN
Active Condo Listings in SoHo, Lower East Side & Murray Hill

Listing Courtesy of Modern Spaces

Listing Courtesy of Douglas Elliman Real Estate
BROOKLYN & QUEENS
Active Condo Listings in Williamsburg, Downtown Brooklyn & Long Island City

Listed by EXP REALTY LLC

Listed by EXP REALTY LLC
NEW JERSEY
Active Condo Listings in Downtown Jersey City & Hoboken

Ready To Buy? Thinking About Selling? LET'S CHAT!
Phone